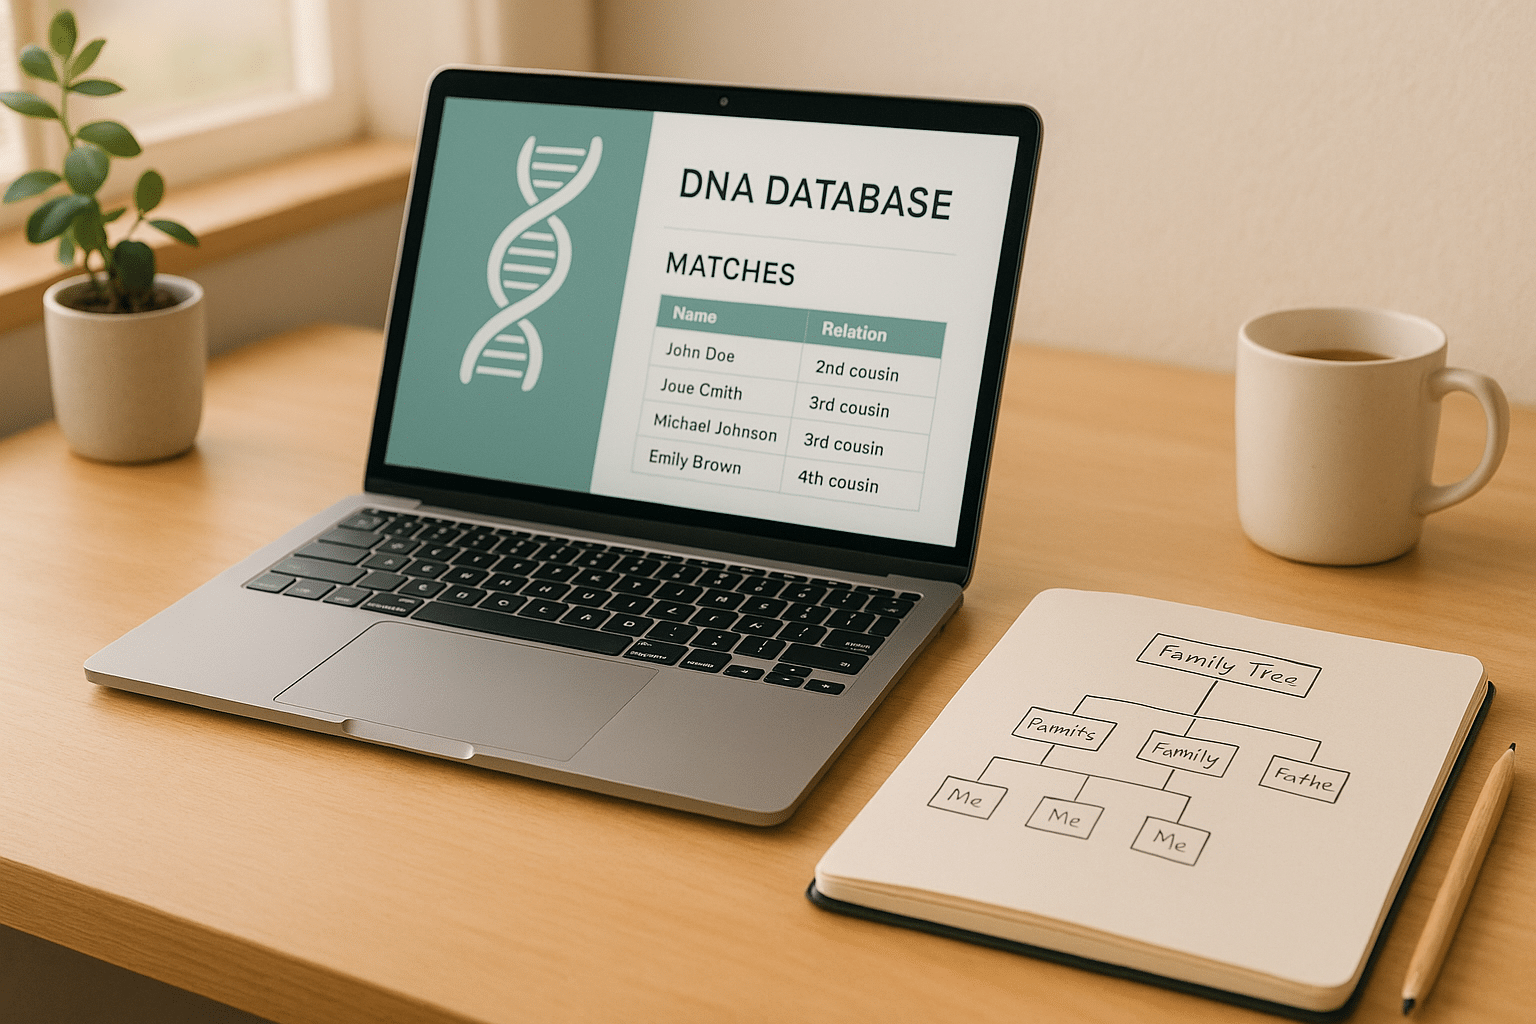
DNA AutoClusters simplify complex DNA match data by organizing it into visual, color-coded clusters. These clusters group DNA matches based on shared genetic material, helping you identify family lines and ancestral connections quickly and effectively.
Key Benefits:
- Organizes Matches: Groups DNA matches into manageable clusters.
- Reveals Family Lines: Highlights shared ancestors and distinct family branches.
- Saves Time: Automates analysis of large DNA match lists.
How It Works:
- Data Filtering: Focus on matches that surpass a preset threshold.
- Matrix Creation: Analyze shared DNA segments to identify connections.
- Cluster Formation: Group matches into visual, color-coded clusters.
Uses:
- Identify related match groups.
- Manage large DNA match lists.
- Map out family lines and confirm relationships.
You can enhance your results by combining AutoClusters with traditional genealogy methods and tools like GEDmatch for deeper insights. This tool is especially useful for anyone looking to simplify and streamline their genetic genealogy research.
Where to start:
Several tools at GedMatch use AutoClusters:
- Clusters With AutoTree: Groups your matches by how they match each other, forming clusters likely to share a common ancestor.
- AutoKinship: Reconstructs kinship/ancestor relationships among the clusters and your matches.
- AutoSegment: Groups matches into clusters based on shared segments.
Visualizing Ancestral Lines with DNA AutoClusters

How AutoClusters Process DNA Data
AutoClusters organize DNA data into visual groups, making it easier to interpret genetic connections. Here’s how the system works.
Steps in DNA Clustering
The process involves several key steps to organize DNA matches:
- Data Collection and Filtering
The system collects DNA match data, focusing on matches that surpass a threshold of shared DNA. This ensures the inclusion of meaningful genetic relationships while excluding smaller, less useful matches. - Matrix Creation
A matrix is created to analyze shared DNA segments and their positions on chromosomes. These patterns help the system identify and group related matches. - Cluster Formation
Matches sharing common ancestors are grouped into clusters. Each cluster represents a unique ancestral line.
Reading Cluster Charts
AutoCluster results are displayed in an interactive matrix, making it easier to understand relationships. Here’s what to look for:
- Color-Coding System
Each cluster is assigned a distinct color. Matches appearing in multiple clusters are shown in gray, while white spaces indicate little or no shared DNA. - Matrix Navigation
Matches are listed along both the vertical and horizontal axes. The colored cells show relationships between pairs, with darker colors indicating stronger shared DNA connections.
Main Uses of AutoClusters
Finding Related Match Groups
AutoClusters help pinpoint groups of matches that share a common ancestor. By grouping matches based on shared DNA segments, you can focus on the most genetically connected clusters first. Each cluster highlights a specific family line, making it simpler to explore individual branches of your ancestry without getting bogged down by unrelated matches.
Managing Large Match Lists
DNA testing often results in hundreds or even thousands of matches, which can be overwhelming to analyze manually. AutoClusters simplify this process by organizing these matches into clear, structured groups based on shared genetic traits. This makes it easier to:
- Prioritize Research: Focus on the most relevant groups of matches.
- Save Time: Quickly identify which connections are worth exploring first.
- Simplify Analysis: Break large, confusing match lists into smaller, logical sections.
Mapping Family Lines
Clusters not only organize matches but also help visualize distinct family branches. With AutoClusters, you can:
- Spot Ancestral Groups: Identify groups sharing specific DNA patterns.
- Verify Connections: Confirm relationships by checking shared DNA amounts.
- Trace Family Lines: Map out how different branches of your family tree connect.
Each cluster represents a separate ancestral line, offering a clear view of how your family lines intersect and branch out. The visual tools provided by AutoClusters make it easier to interpret these relationships.
sbb-itb-65d4ad3
Reading Your Results
This section helps you interpret your AutoCluster results, building on insights from the clustering charts.
Color Codes and Groups
The AutoCluster visualization uses different colors to highlight unique genetic groups. Each colored block represents matches who share DNA with one another. Pay attention to the size of clusters, the intensity of the colors, and how patterns are distributed to understand the strength of these connections.
Finding Ancestor Groups
To figure out which ancestral lines are represented in each cluster, start with your largest and most well-defined groups.
- Identify known relatives in the clusters to create a starting point for your analysis. Use the One-to-One Autosomal DNA Comparison tool to confirm relationships.
- Look for recurring surnames, geographic connections, or time periods within the clusters to narrow down specific ancestral groups.
- Keep track of which clusters correspond to particular family lines to create a detailed genetic ancestry map.
These steps help you connect the visual data to meaningful family history insights.
Solving Common Problems
Once you’ve identified ancestral groups, you might encounter a few challenges:
- Overlapping Clusters: Intermarriage or distant common ancestors can cause overlap. Use One-to-One comparisons to sort out these overlaps.
- Unassigned Matches: Some matches may not fit neatly into clusters, often because they share DNA with very few others or have distant relationships.
- Missing Information: Clusters without enough data to identify common ancestors may require reviewing external matches or reaching out to matches for more details.
Limits and Tips
Effects of Related Ancestors
AutoCluster tools can have limitations, especially when ancestors are linked through multiple family lines. This often results in overlapping or merged groups that are tricky to interpret. This issue is more common in populations with a history of intermarriage or close-knit communities, where relatives may appear in several clusters. For example, second cousins might show up across different clusters, making it harder to pinpoint specific family lines. To address this, use the One-to-One Autosomal DNA Comparison tool to confirm exact relationships and untangle these overlapping connections. Pair these findings with other research approaches to strengthen your conclusions.
Combining with Traditional Methods
AutoClusters are most effective when paired with classic genealogy techniques. Here are a couple of ways to enhance your research:
- Use admixture tools to pinpoint your biogeographical ancestry and verify family roots.
- Compare one-to-one autosomal DNA results to confirm specific relationships.
- Find documentary evidence to confirm predicted relationships.
Handling Unmatched DNA
Not all DNA matches fit neatly into clusters. Some remain unassigned, which can be frustrating. Focus on matches with larger amounts of shared DNA and verify their relationships using one-to-one autosomal comparison tools. Additionally, digging into your family tree and documented ancestry can help make sense of these unmatched results. This extra effort can provide clarity when clusters don’t tell the full story.
GEDmatch AutoCluster Tools
- Clusters With AutoTree: Groups your matches by how they match each other, forming clusters likely to share a common ancestor.
- AutoKinship: Reconstructs kinship/ancestor relationships among the clusters and your matches.
- AutoSegment: Groups matches into clusters based on shared segments.
Uploading Your DNA to GEDmatch
To start using AutoCluster analysis, follow these steps:
- Download your raw DNA file from your testing service. GEDmatch supports files from providers like 23andMe, Ancestry, LivingDNA, and MyHeritage.
- Upload your file to GEDmatch and check its processing status on your dashboard. Uploads typically take around 24 hours to process.
Advanced Features for Premium Users
GEDmatch’s Tier 1 membership offers extra tools for deeper insights into your DNA. Features like AutoSegment and AutoKinship provide more detailed information about your genetic connections. These tools can help you map out relationships and trace family lines with greater precision.
Summary
Main Benefits
AutoClusters simplify genetic genealogy by organizing large sets of DNA match data into easy-to-understand groups. Here’s how it helps:
- Organizes Matches: Automatically sorts hundreds or even thousands of DNA matches into groups.
- Recognizes Patterns: Uses visual clustering to reveal shared ancestor lines.
- Saves Time: Automates grouping, cutting down on the need for manual analysis.
GEDmatch’s tools make it easy to incorporate these steps into your research. By following these tips, you can make your AutoClusters analysis much more effective.